Most articles about TradingView list the same handful of indicators everyone already knows.
You’ve seen them a thousand times: RSI, MACD, Bollinger Bands… rinse, repeat.
This isn’t that list.
These are the tools inside TradingView that quietly make you more accurate, more organized, and less stressed while trading.
The tools that real traders rely on once the novelty of fancy indicators wears off.
If you want to try these tools out, you can use the same link I used when I first signed up:
Let’s jump in.
1. Bar Replay (The Best Practice Tool Nobody Uses Enough)
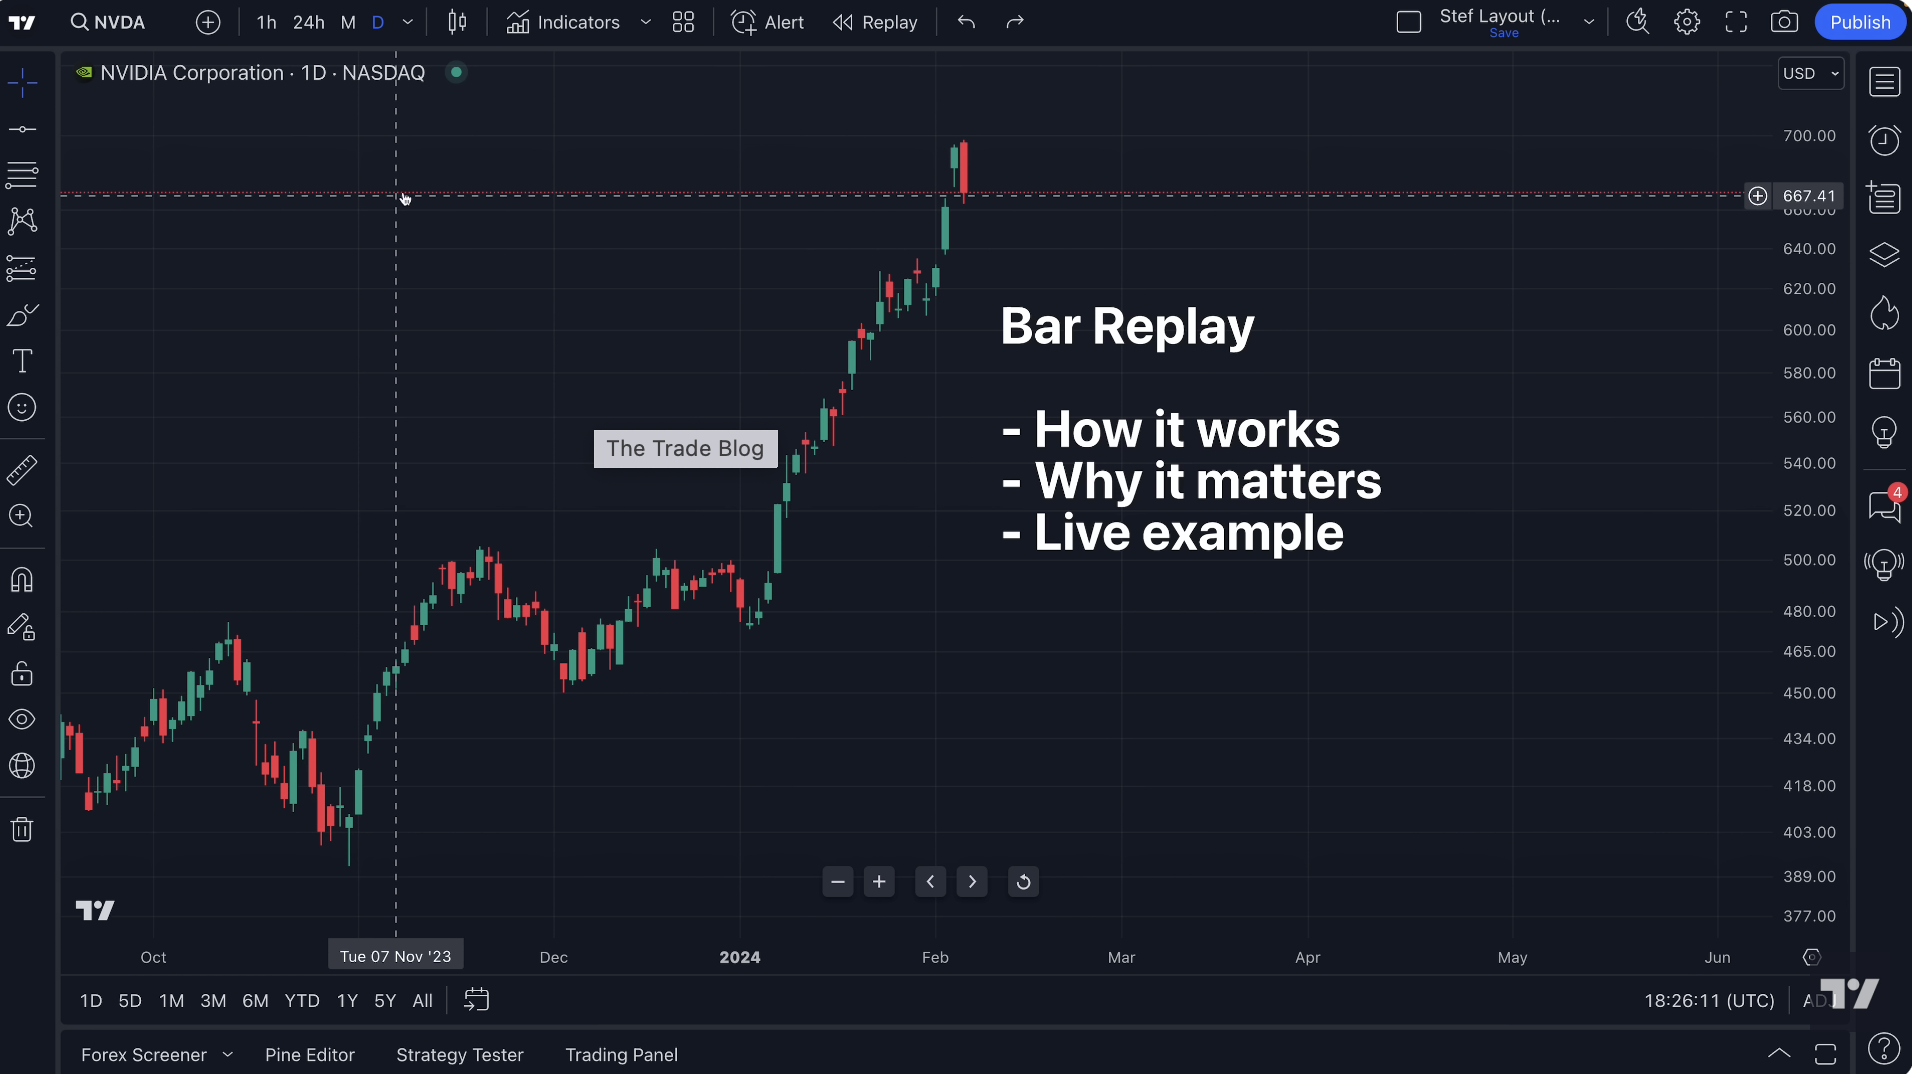
Bar Replay lets you “scroll back in time” and trade a past market candle-by-candle.
Most new traders never use it.
Experienced traders use it religiously.
Why it works:
You learn how price actually develops instead of cherry-picking perfect hindsight setups.
Even five minutes of replay a day can sharpen your timing dramatically.
2. Alerts on Indicators (Not Just Price)
Most platforms let you set alerts at a price level.
TradingView allows alerts when indicators hit your conditions.
For example:
EMA crossovers
RSI hitting a threshold
MACD turning positive
Volume spikes
It’s like having a second pair of eyes watching the chart while you live your life.
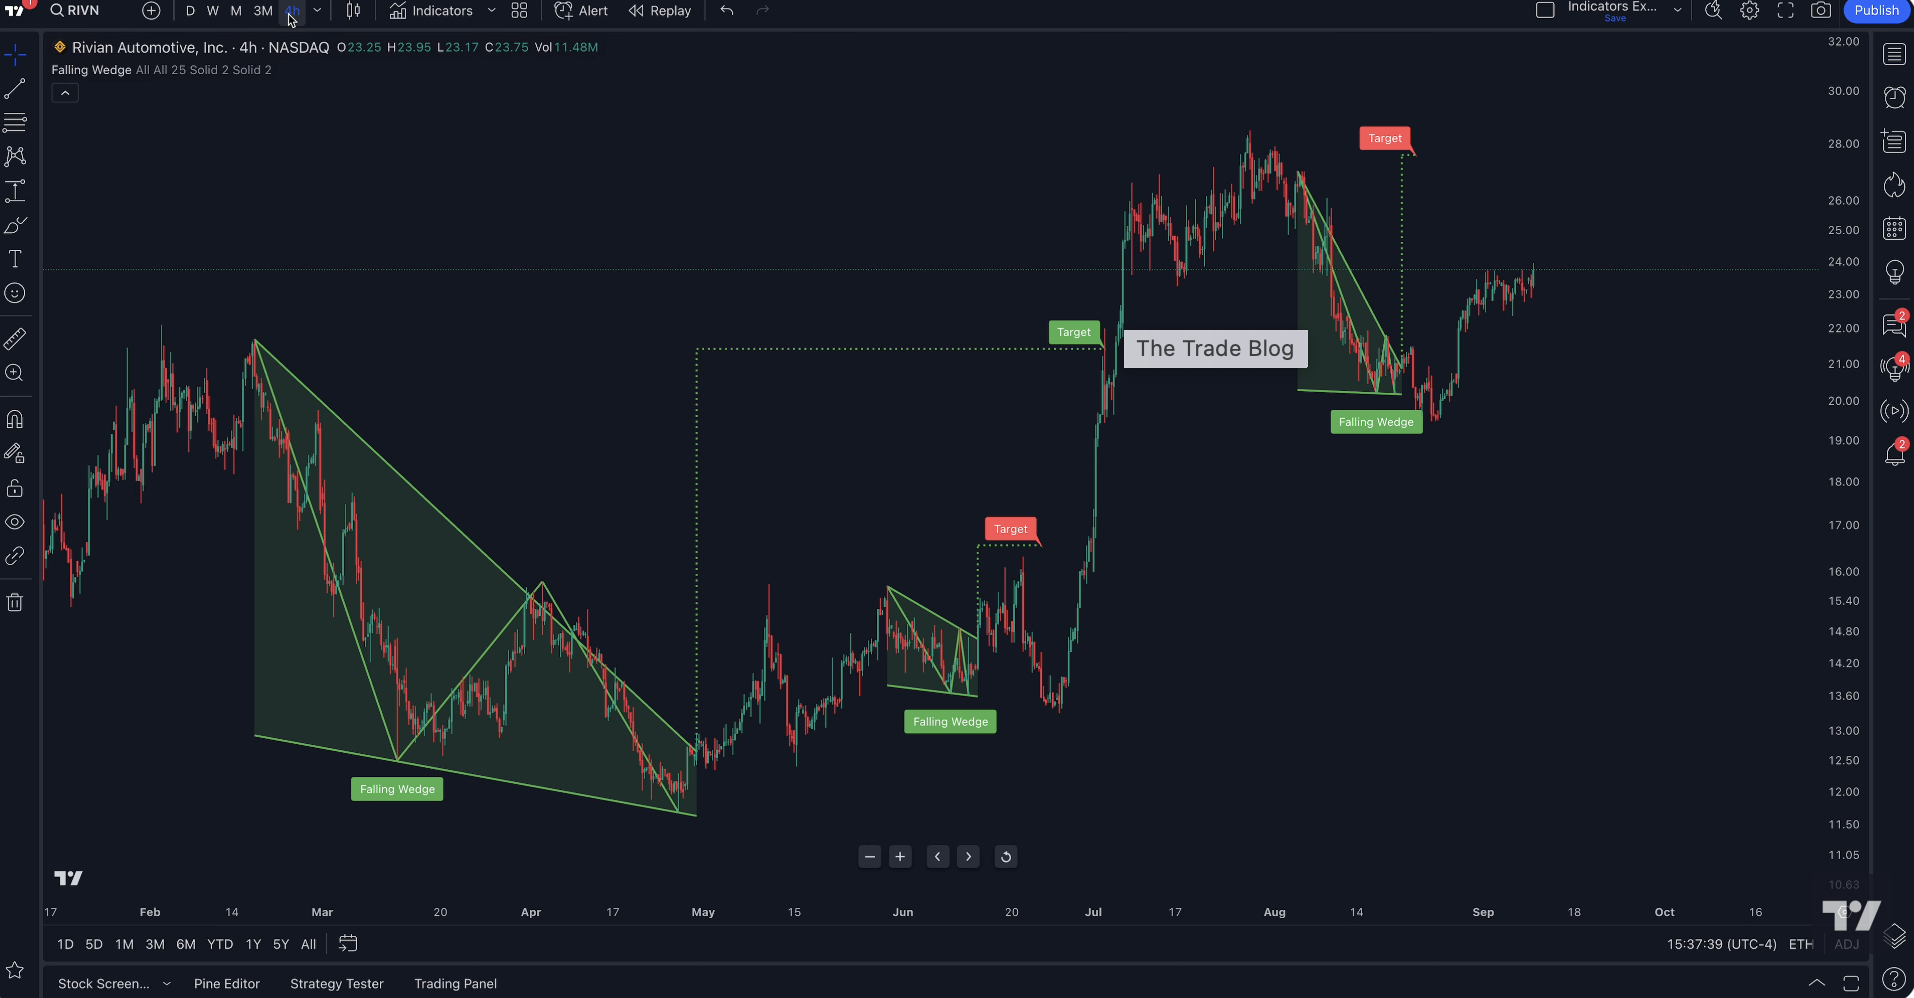
3. Fixed-Range Volume Profile
This is one of my favorite tools — and one of the most overlooked.
Drop it on any structure and instantly see:
Where the heaviest trading took place
Where price is likely to stall
Where liquidity sits waiting
If you’re trying to avoid random entries, this tool alone will help tighten your decisions.
4. Multi-Timeframe Watchlists
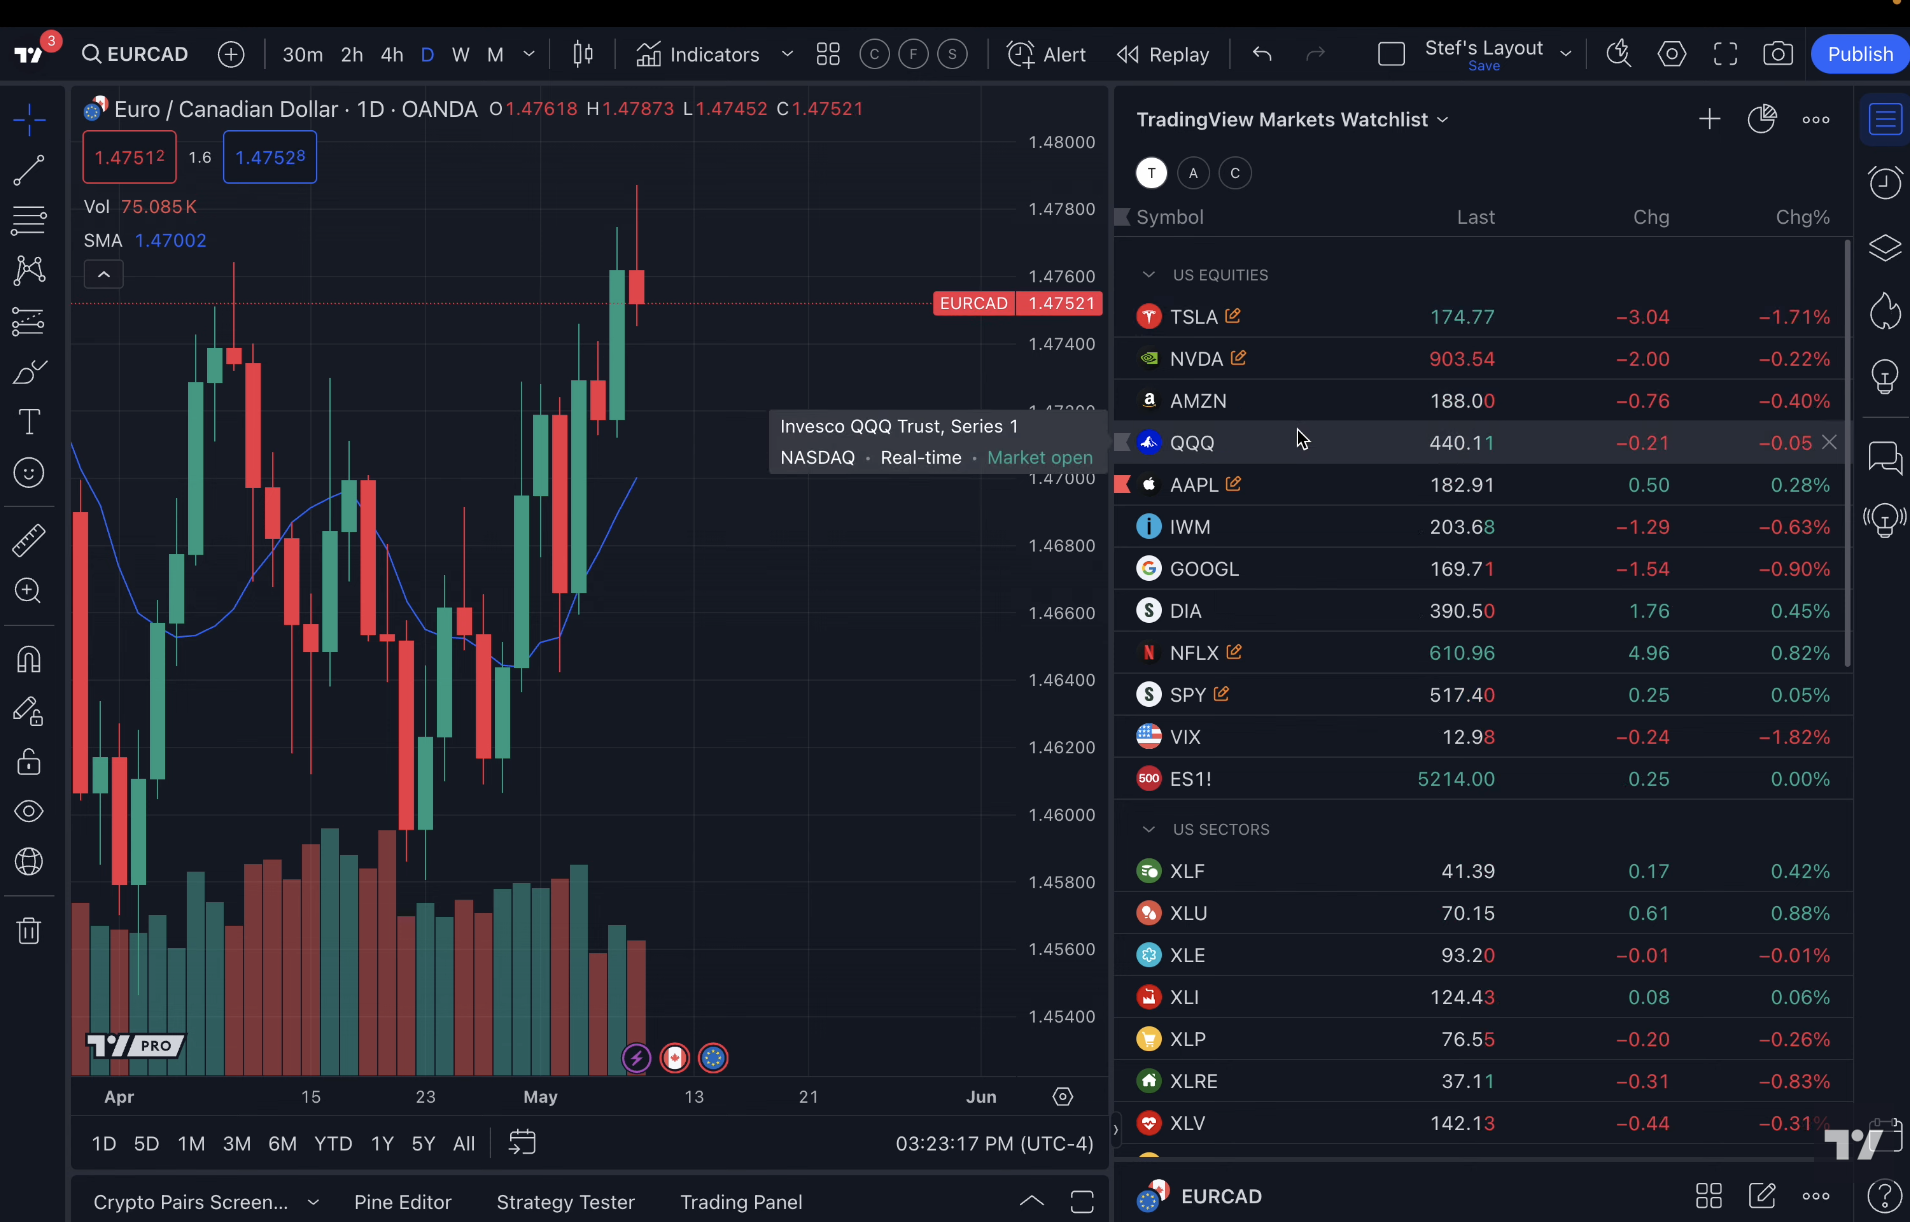
You can create watchlists that show:
The current timeframe trend
If price is above/below a key level
Whether volatility is rising
If your setup conditions are met
It feels like having a dashboard for the entire market.
5. Drawing Templates
Ever redraw support/resistance the same way every day?
Or recreate your Fibonacci settings again and again?
Set up templates once and apply them with a click.
You’ll be shocked how much time this saves.
6. Chart Layout Syncing
If you trade multiple tickers or markets, you can sync drawing tools across all timeframes.
Draw something on the daily → it shows on the 15-minute → and the 1-minute.
Everything stays organized without extra work.
7. Heatmaps (Crypto, Stocks, Forex)
Instead of scanning endless tickers, glance at a heatmap and instantly see what’s strong, weak, moving, or cooling down.
This is incredibly useful for:
Finding momentum trades
Identifying rotation
Spotting red flags early
8. Compare Tool (Overlay Charts)
TradingView lets you overlay charts on top of each other.
Examples:
ES vs NQ
BTC vs ETH
Your stock vs its sector ETF
Correlation tells a story.
TradingView makes that story easy to read.
9. Alerts on Drawing Objects
Few people know this exists.
You can set alerts on things like:
Trendlines
Channels
Zones
Diagonal support
Volume Profile levels
The moment price touches your line, you get notified.
No babysitting.
10. Watchlist Notes (Small but Powerful)
I treat watchlist notes like a trading journal.
Quick notes such as:
“Support at 4175”
“Big earnings next week”
“Volume spike yesterday”
It keeps your mind clear and your prep consistent.
If You Want to Try These Yourself…
I use these tools every day because they make trading cleaner and more efficient without adding complexity.
If you want to test them out, here’s the same link I used to get started: